Monitoring
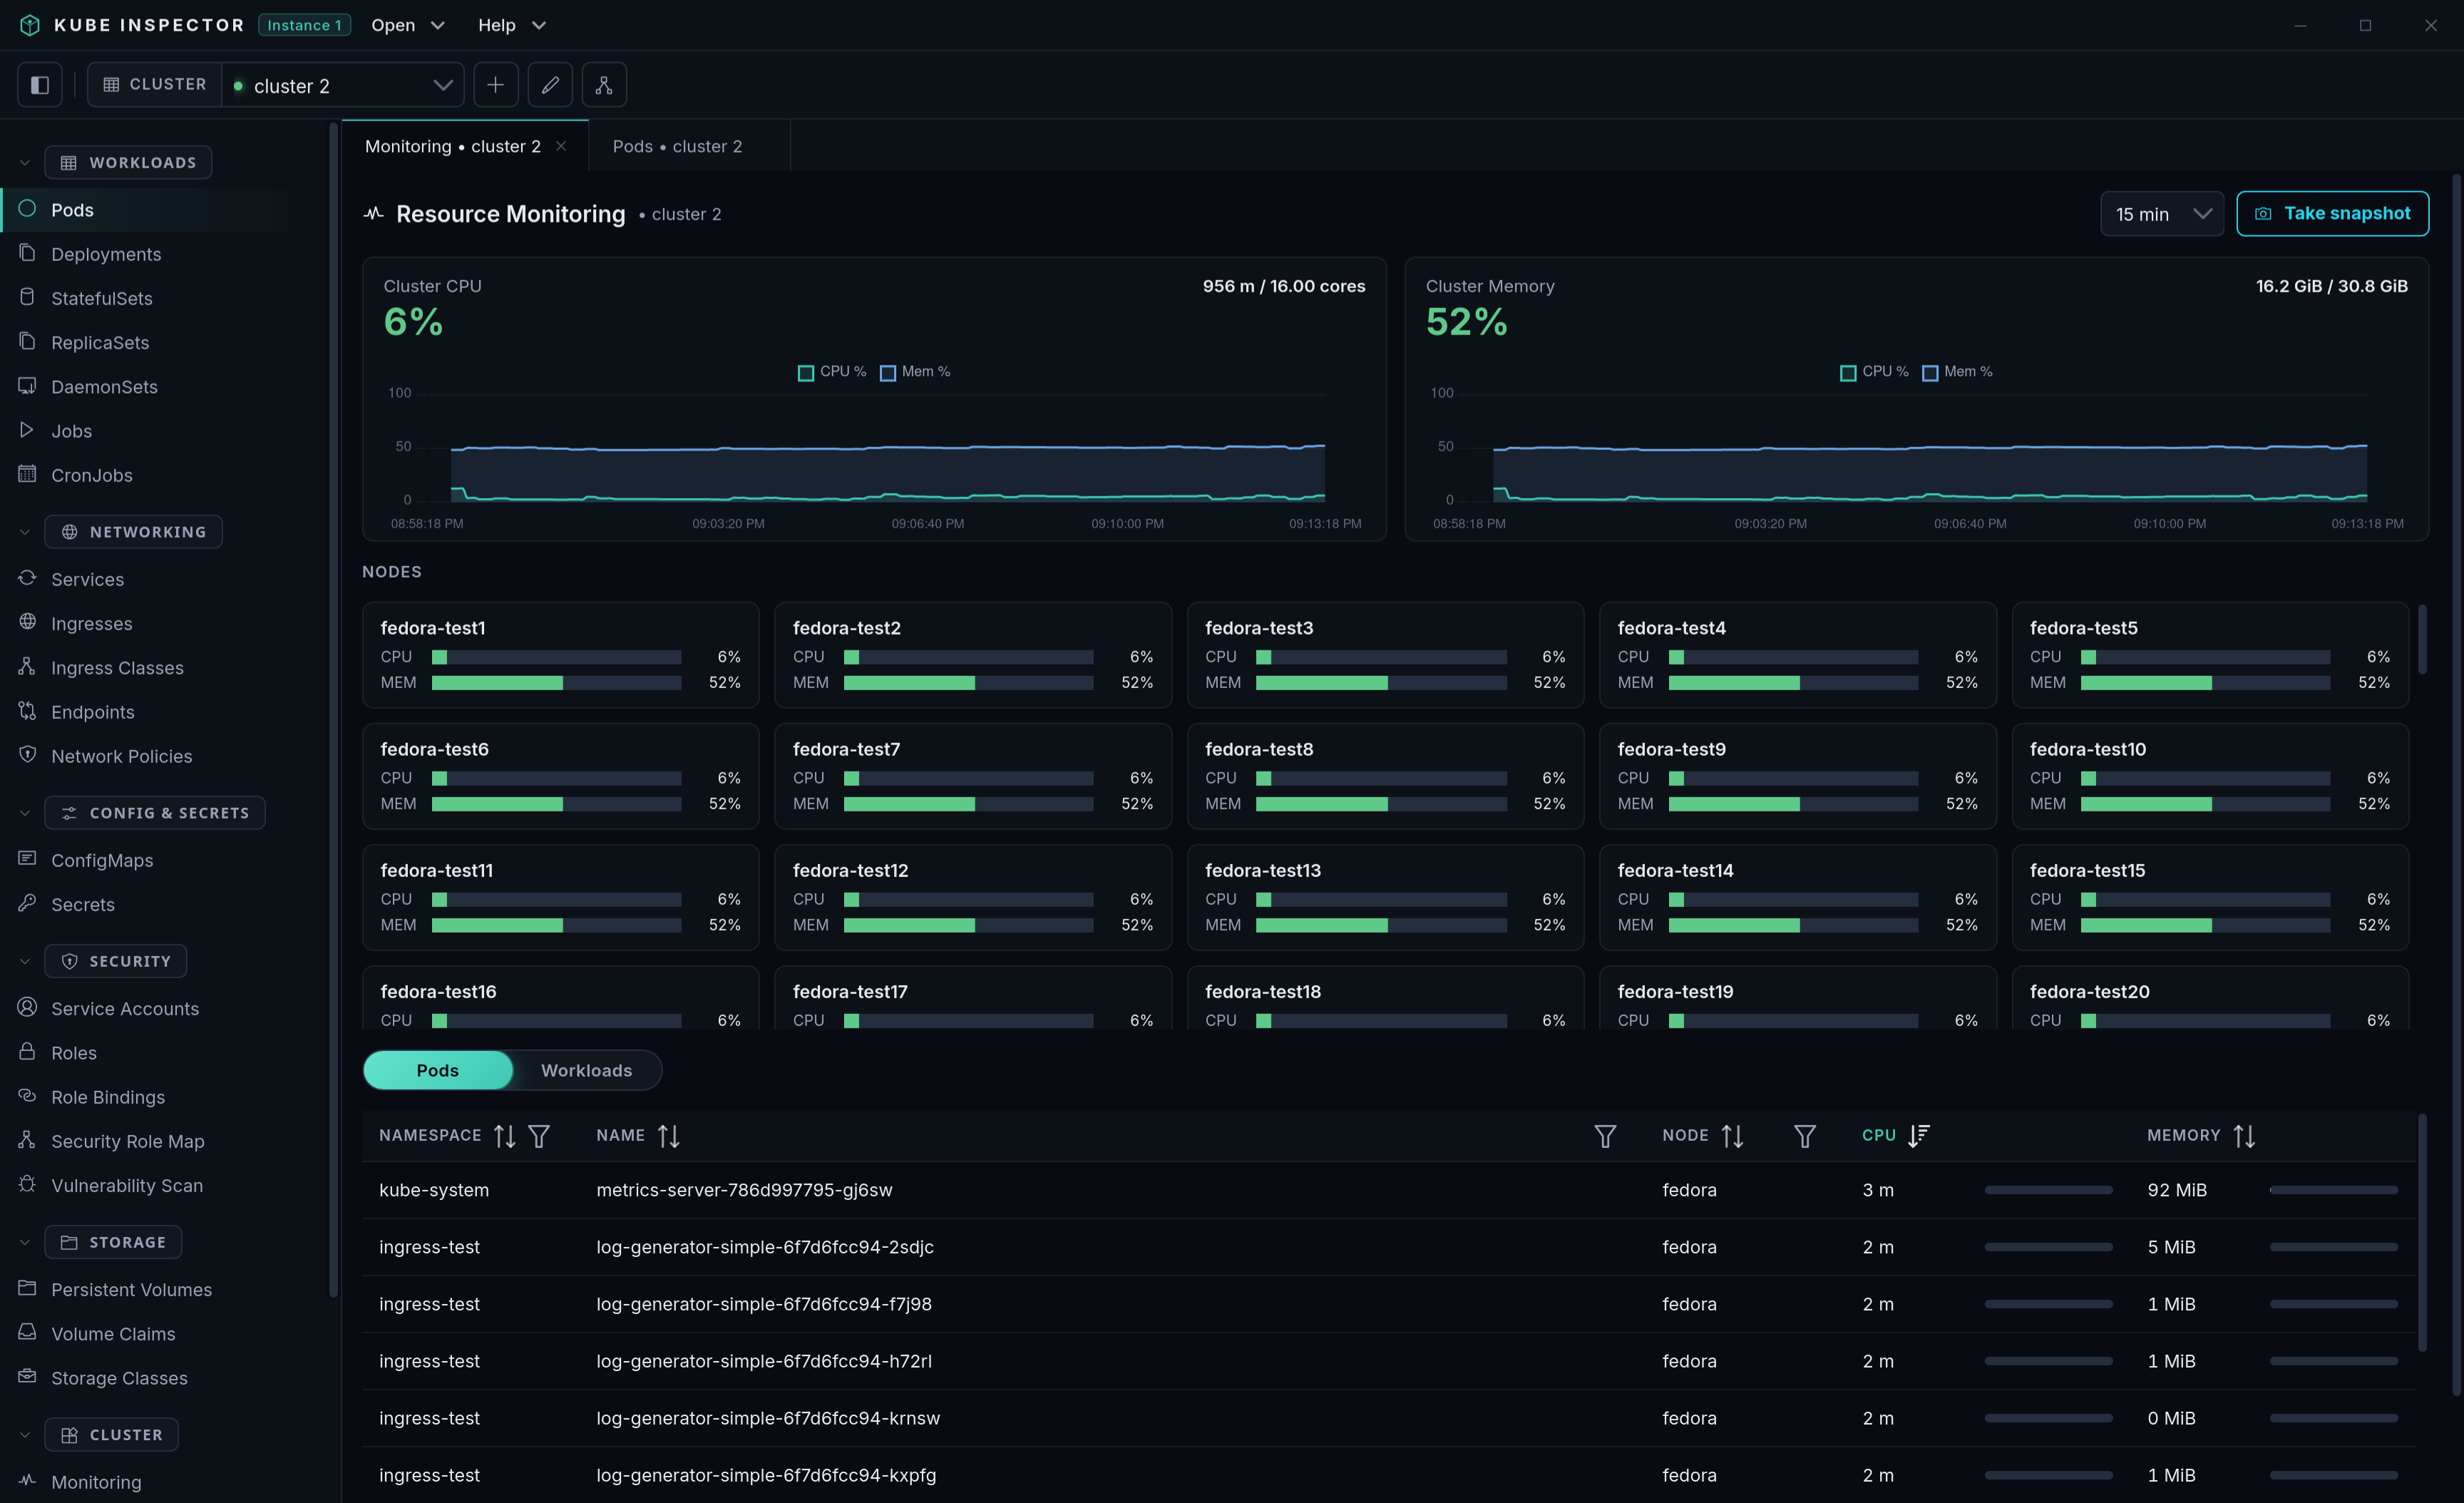
The Monitoring screen is a live resource-usage dashboard for the cluster, built from metrics-server.
Requires metrics-server
Usage data comes from the Kubernetes metrics API. If metrics-server is not installed in the cluster, the screen shows a notice and no charts. Capacity (but not usage) may still be shown.
What's on screen
- Cluster summary — total CPU and memory used vs. capacity, with a rolling usage trend.
- Nodes — per-node CPU and memory usage bars (scrollable when there are many nodes).
- Top consumers — a sortable, filterable table; switch between Pods and Workloads (Deployments/StatefulSets etc., aggregated from their pods). Each row shows CPU and memory with a bar relative to cluster capacity.
Drill-down
Click any node, pod or workload row to open a detail drawer with:
- CPU and memory trend charts over the selected time window.
- For a pod: a per-container usage breakdown.
- For a workload: its member pods (click one to drill into it).
- For a node: the pods running on it (click one to drill in).
Time window & snapshots
- The time-window dropdown (5 min → 2 hours) scales every chart to that range.
- Take snapshot captures the whole dashboard as a PNG via a native save dialog.
History is live and in-memory
Trends are accumulated while the screen is open (polled every few seconds) and kept in memory only — they reset when the app restarts. There is no long-term/historical store.